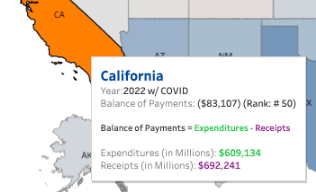
In 2022, Californians paid about $83 billion dollars more in federal taxes than we received in federal spending, according to a study by the Rockefeller Institute of Government.
This map, found on the Institute’s Balance of Payments Portal, has been all over the news in the past couple of months:
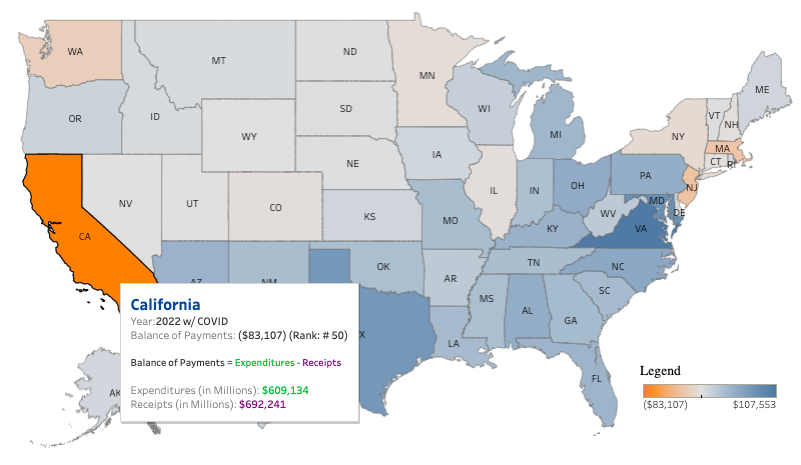
Columnist Philip Bump cited the 2022 data in a column about the L.A. fires, concluding, “the funding to which those Republicans are tying political strings can accurately be described as California’s money in the first place.” Economist Paul Krugman included the map in his Substack post, In Praise of California, arguing, without California, “America would be a lot poorer and weaker than it is.” Newsweek asked, Does California’s Economy Prop Up Red States? And Axios published an article calling California one of the states “least reliant on the federal government.”
Surprisingly, none of these articles talked about Rockefeller Institute data from any other year, despite the Balance of Payments Portal helpfully offering data (and maps!) going all the way back to 2015.
These four articles rest some pretty weighty arguments on what is, essentially, a single data point. (To be fair, Paul Krugman did offer some related data of his own from 2016.)
Is it accurate to describe the federal funding California gets as California’s own money? Would the U.S. be poorer and weaker without California? Does California’s economy prop up red states? Is California one of the states least reliant on the federal government?
The short answer to all these questions is yes. By dumb luck, that one data point tells stories that are basically truthful and accurate. California really is a donor state.
But it’s pretty hard to win a debate with just one data point. Especially when the previous data point shows that in 2021, California received almost $200 billion more in spending than we paid in taxes.
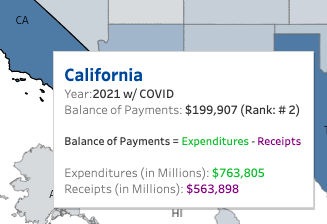
Oh snap! What now, Axios? What now, Newsweek? What now, Philip Bump? What—oh, it looks like Paul Krugman really knows what he’s talking about and wouldn’t fall for this kind of cheap shot.
For those of you have forgotten (or are trying really hard to), 2020 and 2021 were extremely unusual years due to the COVID pandemic, not just for every aspect of our lives, but also for the federal budget. The map even tips you off to this, noting that the 2021 data comes “with COVID” (it’s cool, I’m vaccinated). But to understand what’s normal and what’s not, you’d probably want to look at all eight years of available data, and take a peek at what was happening in other states. You’d want to get the full story.
Lucky for you, that’s exactly what this article is: the story of what it means for California to be a donor state. I’m going to show you a bunch of different ways of looking at and thinking about the data. Though I’ll be honest about my opinions, it’ll ultimately be up to you to decide what to make of the graphs and numbers I present.
Together, we’re going to learn why figures like the $83 billion dollar figure above tell us more a lot more about federal deficit spending than a state’s relationship with the federal government—but they do tell us which states actually need the federal government. We’ll see how we can understand these relationships better by accounting for deficit spending—but also how that can make us feel like we missed out on money that was never there in the first place. We’ll look at two different ways of measuring how (un)fairly California is treated by the federal government. Finally, we’ll explore how life might be different for Californians if we declared (fiscal) independence from the United States.
At the end of it all, you’ll be an expert on what it means for California to be a donor state.
Great data still has its limits
I use several data sources in this article, including population and poverty estimates from the U.S. Census and inflation data from the federal Bureau of Labor Statistics. But the Rockefeller Institute’s dataset is very much the star of this show.
Even stars have their limits. Here are five things you should know about the dataset:
- it only includes at federal spending and taxes in states, not D.C. or Puerto Rico
- its 2022 figures are likely to be revised later this year when new federal data is available
- it doesn’t include tariffs (about 2% of federal revenue) because they’re “unallocable”
- it doesn’t adjust for inflation
- it doesn’t include interest on the national debt
(Want to know more? It’s all in pages 40-58 of their latest report!)
Personally, these are limitations I can work with, which is why I’ve chosen to sink hours of my time into writing this article. If it were up to me, I would have allocated tariffs among states using state trade data, but it’s only 2% of taxes, so I’ll let it be.
It’s also pretty reasonable for the dataset to use raw dollar amounts, because it’s, well, a dataset. But it’s not reasonable for me to base a multi-year analysis on these figures without adjusting them for inflation. Here’s why: a dollar in 2015 was worth about $1.35 in today’s dollars. Heck, even a 2022 dollar was worth about $1.10 in today’s terms. It’d be like comparing U.S. Dollars to Canadian ones without adjusting for the exchange rate. From now on, you can assume every dollar amount I present is in present-day (Jan. 2025) dollars.
Finally, the question of how to allocate interest on the debt among states is so thorny that we’re actually going to explore a few different ways to think about it later in this article. For now, just keep in mind that the federal government doesn’t just spend money in states; it can also spend up to 15.4% of its budget paying off interest on the national debt.
Let’s get… fiscal?
One last thing you need to know before we get started. “2022” on the map I showed above doesn’t really mean 2022, it means the 12-month period from October 1, 2021 through September 30, 2022. Whaaaaaaat?
The federal budget operates on fiscal years, which is actually pretty common for government (and business). For reasons not really worth going into here, the federal fiscal year starts with October of the previous calendar year.
Fiscal years are actually the normal way policy people talk about budgets; they usually just don’t make a big deal out of it, tucking “fiscal year” into the corner of a graph or whatever. Only people in the know (that’s you!) even think about the difference between fiscal and calendar years.
In this article, years are almost always federal fiscal years; if I mean something else, I’ll use a date or say “calendar year” explicitly. If you ever need it, definitions of “federal fiscal year,” “calendar year,” and every other term I introduce in bold can be found in the Glossary at the end of this article.
Just to be 100% transparent: since U.S. Census figures are by calendar year, I use weighted averages to get fiscal-year estimates before mixing them with the Rockefeller Institute’s fiscal year data. I use April inflation figures as the baseline for the value of a dollar during a given federal fiscal year.
California’s balance of payments
Good, you’re still here! Let’s get started!
Let’s look at California’s fiscal relationship with the federal government: Californians pay taxes to the feds, the feds spend money on Californians. Here’s what that looks like as a graph:
From 2015 through 2019, the green line (spending) was below the red line (taxes). During that time, Californians actually lost an average of $23 billion dollars of public money into the federal system each year. In other words, California’s balance of payments averaged negative 23 biilion dollars a year. That’s why they call the place I got this data the Balance of Payments Portal. (It could have been the name of a fantasy novel series, but the Rockefeller Institute nabbed it first!) For a sense of scale, $23 billion is almost as much California’s entire yearly budget for higher education (including UC, CSU, and community colleges).
In 2020 and 2021, it looks like something crazy happened (spoiler: it was COVID), the lines crossed, and California suddenly got an average of $280 billion dollars more from the federal government than it collected in taxes. In terms of California’s budget, $280 billion is nearly the size of the entire budget, which is to say, the roughly $300 billion of non-federal dollars our state government spends each year.
Then in 2022, the lines crossed again, leaving us with a negative $91 billion balance of payments. (I said $83 billion at the start of the article, but remember, that was in 2022 dollars and we’re adjusting for inflation.) That’s almost four times as bad as California’s pre-pandemic “normal.” $91 billion is more than California budgets towards K-12 education (the entire public school system). It’s also more than twice as much as California is requesting in federal disaster assistance for the L.A. fires.
Is $91 billion per year California’s new normal, or just a blip? It’s really hard to tell from just one data point. (Do not worry, I will show you many more!!)
Looking at this graph, you might say, except for the two COVID years, California was a donor state, involuntarily “gifting” our hard-earned tax dollars to people in other states. I’m going to use a more specific term: fiscally self-sufficent. Every penny of federal funding Californians received in 2015-2109 and 2022 was just our own federal tax dollars handed back to us. If there had been no such thing as the federal government, Californians would have been able to do exactly the same thing just by taxing ourselves the same amount, and have money left over to significantly improve our world-class public university system.
However, in 2020 and 2021, California was very much fiscally dependent on the federal government. Congress essentially gave us an extra state budget each year, and we used that money to keep people fed and housed and to keep state and local government running. If Californians had wanted to be able to spend public dollars that way without the federal government’s help, we would have had to have saved up $560 billion dollars (almost two years worth of what our state government collects in taxes) in a rainy day fund.
So is California basically self-sufficent, and COVID was a once-in-a-lifetime fluke? Or are California’s claims to self-sufficiency just posturing, easily debunked by how very dependent California was on federal money during the COVID years?
Some of that depends on how frequent and severe you expect COVID-like economic shocks to be. The Great Recession ended in mid-2009, less than 11 years before the COVID lockdown in March 2020. It set off a spike in federal deficit spending (spending more money than collected in taxes) that was lower than the COVID spike but lasted about twice as long.
On the other hand, if California has five more years of losing $91 billion to the federal government, that makes $544 billion—enough to cover whatever federal assistance we might get to weather the next pandemic, financial disaster, or whatever terrible thing the future has in store.
So, it’s complicated, and there’s no one best way to think about it all.
Hopefully, you’ve at least come around to the idea that an image of a box over a map of the U.S. containing a single year’s worth of data doesn’t really do the topic justice.
Before you make up your mind, you might also want to have some idea what was going on with the rest of the country.
As goes California, so goes the nation?
Here’s the same graph, showing federal taxes and spending for all 50 states combined.
Some ways this graph is similar than the one for California alone: there’s a big bulge in spending in 2020 and 2021. Tax revenue also follows a similar pattern, dipping a bit in 2020 and then increasing toward 2020.
How is this graph different? Well, yes, the numbers on the y-axis are bigger. But more importantly, the lines don’t cross anymore. As a whole, U.S. states got more more in federal spending than they pay in federal taxes in every year we have data for.
In fact, those lines haven’t crossed in a long time; the last time the federal government ran a surplus was in 2001. Keep in mind that running a federal surplus doesn’t just mean spending less on states than the federal government collected in taxes. It also means having enough tax dollars left over to pay interest on the national debt!
Finally, there’s another difference between the graphs that’s easy to miss: before the pandemic, the balance of payments for all states grew smoothly from about $600 billion in 2015 to $1 trillion, and then after the pandemic, it was—still a trillion! It didn’t quadruple, like California’s (negative) balance of payments did. Something happened to California that didn’t happen to the rest of the country, making Californians worse off.
California’s return on the dollar
It’d be helpful if we had a way to compare California with other states (or all states combined) on the same graph. But states vary so much in size that if I showed you a graph of several states’ total federal spending and taxation, the only story it would tell is that some states have bigger economies than others.
Instead, let’s ask this question: for every dollar of federal taxes paid, how much did residents of a particular state get back in federal spending? The answer is that state’s return on the dollar. It’s such a useful way of looking at states’ relationship with the federal government that there’s an entire tab for it on the Balance of Payments Portal.
Here’s California’s return on the dollar, compared to the figure for all 50 states combined.
Some obvious things to take note of:
California never does better than average; at best, Californians get 17 cents on the dollar less in federal spending than the average state resident.
The federal government spends about 20% more than it takes in (not counting interest on the national debt).
California’s return on the dollar was less than one in every year but 2020 and 2021. Put another way, California was fiscally self-sufficient in those years.
You might also say, California’s return on dollar has pretty much the same shape as for the country overall. When federal deficits go up, so does California’s return on the dollar. That’s mostly true, but if you look carefully, there’s one important exception:
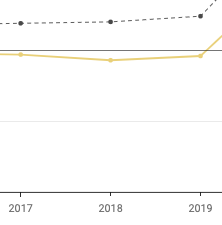
Do you see it? In 2018, the overall return on the dollar ticked slightly up, from $1.19 to $1.20, whereas California’s return on the dollar fell from 97 cents to 93 cents.
That’s probably due to the Trump tax cuts (*cough*, sorry, the Tax Cuts and Jobs Act) which were designed to hurt California and other “blue” states. These tax changes came into effect on—you guessed it—January 1, 2018. Our graph shows fiscal years, and Jan. 1 is actually a quarter of the way through fiscal year 2018, but the effect was big enough that we can still spot it.
What federal spending costs Californians
There’s nothing that says we have to divide spending by taxation. What if we do it the other way around?
Rather than showing how much spending we got for every dollar of taxes, it shows how much we had to pay in taxes to get a dollar in spending back. Instead of return on dollar it’s price per dollar of spending.
For most states, the federal government is a fantastically good deal: chip in no 88 cents or less and get a dollar of spending back! For California, it’s more like a glitchy vending machine: mostly it works, but sometimes you put in your money and nothing comes out. Maybe not a perfect analogy given the way Elon Musk is currently making federal services glitchy for everyone except a handful of Republicans who have his ear, but you get the idea.
Yes, this is basically just the same graph upside-down. But the more metaphors you have under your belt, the easier it’s going to make sense of what’s happening to California.
What it I like about price per dollar as a metric is that it better captures the involuntary nature of Californians’ relationship with the federal government.
“Return on the dollar” kind of makes the federal government sound like an investment vehicle: states put some federal tax dollars in their account and hope to get a solid return, in the form federal spending. But taxes aren’t a choice, and most of the things the federal government spends money on are things we rely on: health care, roads, Social Security, and environmental protection, to name a few.
Having a higher price per dollar of federal spending is like having a utility company that’s arbitrarily chosen to charge you more than your neighbors; it sucks, but it’s also the only game in town, and you don’t want to freeze during the winter.
Or like a health insurance policy that always seems to cost more than it’s worth—until you get really sick.
How California does compared to its peers
Now let’s examine California’s return on the dollar relative to that of other states.
The U.S. has 50 states, which is… kind of a lot. Especially to put on the same graph.
You might have heard that the majority of people in the United States live in the nine most populous states: California, Texas, Florida, New York, Pennsylvania, Illinois, Ohio, Georgia, and North Carolina. Even with just the data from these states, you’d know what’s going on with more than half of the U.S.
Ten is a nice round number, so I’m going to actually show you data for the ten biggest states. That’s right, you get a bonus state! It’s Michigan!
My biggest takeaway from this graph is that California’s return on the dollar in “normal” years went from bad to worse. Our ranking also took a hit: we went from tied for 3rd worst in 2015 to rock bottom in 2022.
Another thing to notice: with the exception of Texas in 2015, the only fiscally self-sufficient states on the graph are politically “blue” states: California, New York, and Illinois. Like California, New York and Illinois were fiscally self-sufficient (their return on the dollar was less than $1.00) in all years but 2020 and 2021.
Something more subtle is that most states’ trajectories don’t follow the all-50-state average as cleanly as California’s. I know, the graph looks just looks like a bunch of colorful spaghetti, but try hovering over it to look at one state at a time, and see how the shapes differ. There’s something eerily stable about California’s fiscal relationship with the U.S. that isn’t quite true even for other large states.
In case you’re wondering how many of the other 40 states were fiscally self-sufficient in 2020 and 2021, the answer is zero. In those two years, state fiscal self-sufficiency was just not a thing.
What about other years?
I personally hate using “number of states” as a unit of measurement because it can be incredibly misleading, due to how vastly states differ in size. It’s kind of like asking someone how many birds they weigh (which you shouldn’t, because it’s rude). Instead, I’m going to give you the answer in terms of population:
In a normal year, about a third of the U.S. population, including residents of California, New York, and Illinois, live in a state that, fiscally speaking, doesn’t really need the federal government.
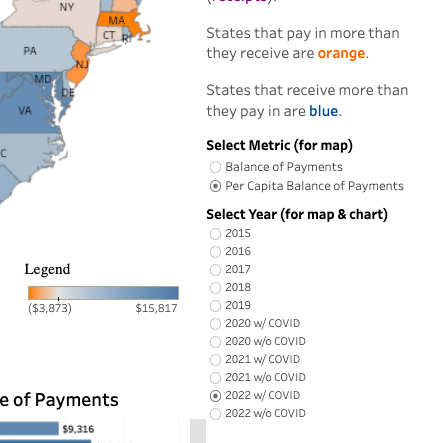
For those who prefer their data “without COVID”
I mentioned above that the Rockefeller Institute offers data “with COVID” and “without COVID.” The Rockefeller Institute broke out the spending from six COVID relief bills (see pages 54-57) into a separate category, and gives users of the Balance of Payments Portal the option to exclude this spending. I guess, to get a better sense of what normal might have looked like?
Personally, I think it’s beside the point. The federal government in fact did spend extra money on COVID relief which states did benefit from. If the Rockefeller Institute had data going back to 2007, would you want to view 2008-2011 data “without Great Recession”?
Still, in case you’re curious (and don’t feel like poking around the map yourself), here are California’s balance-of-payment figures, excluding those six COVID relief bills: 2020: $1.09; 2021: $0.92; 2022: $0.82. California still wasn’t fiscally self-sufficient in 2020, even if we ignore COVID spending. In fact, only one state, New Jersey, made that cut, with a return of 94 cents on the dollar.
Accounting for deficits
I don’t know if you’re tired of me pointing out, for every graph, there’s a big hump (or dip) in 2020 and 2021 because of huge COVID-driven deficit spending, which is not normal. What I do know is that I’m pretty tired of writing it.
What if there were a way to look at the data where the size of federal deficit spending didn’t matter? That would give us a much clearer picture of California’s relationship with the federal government and with other states.
The underlying problem here is that the level of federal spending can be really different from federal tax revenue in any given year. So let’s stop comparing taxes and spending directly.
Instead, let’s take a look at California’s percentage of population, taxes and spending, relative to all 50 states combined.
Now we’re getting somewhere!
This graph tells the most clear story so far about what it means for California to be a donor state: our share of federal taxes keeps going up, even as our share of the population goes down. This is a bad graph for California. Not only is our share of taxes out of whack relative to our population, but it’s getting worse over time!
In a typical year, our percentage of federal spending is also less than our proportion of the population, meaning we get less federal spending per capita than average. Except during the COVID years, when—miracle of miracles!—we actually got more. Very, very slightly more.
Remember that blip in our return on the dollar in 2018 two graphs ago? It turns out that was due to both an increase in our share of taxes (the Trump tax cuts), and a decrease in our share of spending. It’s kind of by dumb luck that we could spot the Trump tax cuts in the return-on-the-dollar graph, but they’re very easy to pick out in this one.
Overtaxed by whom?
But the big story for California is federal taxes, not federal spending. Polling indicates Californians think that we’re overtaxed by an unfair system—but that we think that “unfair system” is our own state and local government. Surprise!
About half of the taxes we pay to “the government” are federal taxes. You simply can’t have an honest conversation about whether Californians are overtaxed (or undertaxed) without talking about federal taxation. At least all of our state and local tax dollars get spent in California!
Public service announcement: anti-tax groups like the Howard Jarvis Taxpayers Association that ask Californians to focus solely on how “overtaxed” we are by our own state and local governments are straight-up gaslighting you. I don’t know a nicer way to say it that wouldn’t be a lie.
Relative share of taxes and spending
How can we make a graph that compares California’s federal taxation and spending with that of other states, without the huge hump in 2020-2021 we saw in other graphs?
We can’t just compare each state’s share of taxes (or spending) side by side because states differ so much in size. So let’s divide each state’s share of federal taxes by its share of the population.
For example, in 2022, California paid 15% of federal taxes paid by states, and only made up 11.8% of the population. 15% divided by 11.8% is 1.27. What this number means is that the average Californian was paying 1.27 times more than average. In other words, for every dollar of federal taxes the average U.S. resident paid, the average Californian paid $1.27.
Here’s relative share of taxes in each year for each of the 10 largest states.
Mostly what I want you to take away from this graph is that each state pretty much stays in its lane (except Florida, not sure what their deal is). Relative share of taxes is a very stable way to describe a state’s long-term fiscal relationship with the federal government.
Also, note the uptick in 2018 for “blue” states California, New York, and Illinois. That’s the Trump tax cuts.
Similarly, we can get a state’s relative share of spending by dividing its share of spending by its share of the population. Here’s what the graph looks like.
Spending figures are a lot more variable, even without the noise of federal deficits. That’s maybe unsurprising, given that the U.S. Constitution requires taxation to be uniform across all states, but doesn’t place similar guardrails on spending.
Texas and New York both managed to increase their share of federal spending somehow, especially between 2019 and 2022. Whereas California’s relative share of spending just oscillated between 93 cents on the dollar and dead-even. Maybe we should ask Texas and New York what their secret is?
Do Californians deserve this?
Some people might look at these graphs and say, well, California’s higher share of taxes is just a natural consequence of being the state with the 5th highest per capita income. And California’s somewhat lower share of spending is because… well, never mind all that.
Maybe it’s only to be expected we pay such a disproportionate share of federal taxes? Like, in a fair system, wouldn’t we want to redistribute some of our tax dollars to whatever state has the highest rate of poverty? We might also want to let them keep more of their tax dollars in-state so they could take better care of their own people.
Only, the state with the highest rate of poverty is California.
This graph only shows the 10 biggest states, but even if I’d included all 50, California would still be at the top every year except in calendar years 2019 and 2022, when we had the second highest poverty rate (behind Louisiana, in 2019 and Mississippi, in 2022).
The metric in this graph is the supplemental poverty measure (SPM), a figure devised by the U.S. census to that attempts to capture the reality of poverty by including the cost of housing, food, and so on—it captures the brutal reality of trying to make ends meet in a high-cost state like California. This stands in contrast to the federal government’s official poverty measure (OPM), which just measures whether your income is below a certain number of dollars (the “poverty line”).
The federal government uses the OPM to gate access to most services: Medicaid, food stamps, welfare payments, health care exchange supplements, and so on. Which makes it harder for Californians living in actual poverty to qualify for these federally funded services. In contrast, it appears the primary way the SPM is used is by politicians and opinion columnists to shame California for not taking care of our own people.
We know anti-poverty spending works because some of that massive amount of COVID relief in 2020 and 2021 was dedicated to housing and feeding people, and (see the graph). California’s poverty rate dropped from 19% in 2019 to 14% in 2021. In fact every state on the graph hit its minimum poverty rate in 2021. Remember Project Roomkey? That was COVID relief funding.
So as for the idea that the federal government should give more help to the states experiencing the highest rate of poverty? Well, that’s a very Christian sentiment! Let’s see what happens in reality.
This graph works the same way as the “Relative share of federal spending” graph above, instead of comparing against the total population, we only count people experiencing poverty. The least among us, if you will.
At between 69 and 77 cents on the dollar, California is at the very bottom for federal spending relative to poverty. And not just of the 10 states shown—of all 50!
In practice, less than a quarter of federal spending is devoted to the kind of anti-poverty services I mentioned above right now. (And self-identified “Christians” in Congress seem hellbent on making that share even smaller.) Still, I hope the graph above dispels the idea that the the federal government gives some states more spending than others because they care about helping poor people.
What if, instead, Californians taxed ourselves more to address poverty in our state? Would the federal government at let us keep more of our public tax dollars in California?
Funny thing about that, they used to! There used to be something called the State and Local Tax deduction (SALT), which meant that people paid federal income taxes have to count money they paid toward state and local taxes as part of their taxable income. As well as being a fairer system (it’s not really Income if you lose it to taxation), it acted as a gentle incentive for states to tax themselves to take care of their own problems.
Only, the 2017 Trump tax cuts put a strict cap on the SALT deduction. California can still tax high-income earners, but it that won’t do anything to keep our federal tax dollars from leaving California.
People have different ideas about what’s fair, and you should draw your own conclusions. I just don’t want you to think that California’s relationship with federal taxation and spending is somehow just a neutral, natural consequence of California’s high per capita income. The federal government chooses not to account for real poverty in California even when it has a perfectly good way of doing so. The federal government chooses to target California and other “blue” states by capping the SALT deduction. And the way the federal government makes those choices doesn’t give Californians much of a voice, thanks to the U.S. Senate and the electoral college.
It’s kind of a cliché to talk about “the government” doing stuff on its own as if its choices had nothing to do our own votes, but when Californians talk about the federal government that way, we’re not wrong.
Providers and consumers
If caring for the least among us is a fruitless way to measure fairness in federal spending, what’s a better one?
Adam Smith, father of capitalism, had this to say about taxation:
The subjects of every [country] ought to contribute towards the support of the government, as nearly as possible, in proportion to their respective abilities; that is, in proportion to the revenue which they respectively enjoy under the protection of the [country].
Apply that logic to U.S. states, and it pretty clearly implies each state should pay federal taxes proportional to the federal spending (“revenue”) it receives.
(By the way, the actual word Smith used for “country” was “state”—I hope you see why that’s confusing in this context.)
By Smith’s metric, a state is being treated fairly if its share of federal spending and federal taxation are the same. What happens if we divide a state’s share of federal spending by its share of federal taxation? Well, we get 1, right? Because it’s a fair system?
What we actually get is a state’s relative return on the dollar. Here’s what that looks like:
States with a relative return below $1.00 line, like California, New York, Illinois, and (mostly) Texas are “donor” states in a different sense: their share of federal taxes is bigger than their share of federal spending. Let’s call these provider states because they pull more than their share of the weight.
In contrast, those above the $1.00 line get a greater share of federal spending than they pay in taxes; these include North Carolina, Ohio, Michigan, Georgia, and Pennsylvania. Let’s call these consumer states because they consume those extra dollars the provider states put into the system.
Unlike fiscal self-sufficiency, which captures states’ relationship with the federal government (and its incredible ability to borrow money), the provider vs. consumer dichotomy sets federal borrowing aside and captures’ states’ relationship to each other.
States can be providers without being fiscally self-sufficient, like California in 2020-2021 (or Texas in every year except 2015).
In principle, a state could be self-sufficient while also being a consumer state, but that’s only mathematically possible when the federal government takes in more in taxes than it spends (which hasn’t happened since 2001).
If the federal government spent exactly as much in U.S. states as it collected from them in taxes, provider and self-sufficient states would be the same thing. Which means the federal government would literally be a machine that takes tax dollars from mostly “blue” provider states and redistributes them to mostly “red” consumer states. The only thing that makes the current state of fiscal affairs tenable politically is deficit spending.
Even viewed through the lens of Adam Smith’s rather limited moral universe, California was treated terribly; we went from tied with Texas for third most unfair treatment in 2015 to dead last in 2022.
Just like… oh! Our original return-on-the-dollar graph. That’s because it kind of is the original return-on-the-dollar graph, only the “All 50 States” line has been flattened out, and the rest of the y-axis has moved with it.
Dollars diverted
What does relative return on the dollar actually mean? We know what more than $1.00 and less than $1.00 means. But, like, California’s relative return on the dollar in 2022 was 74 cents. What does 74 cents mean? What dollar are we comparing it to?
One way to think about this number is that it’s a pretty good way to guess of what would happen to a state’s federal tax dollars if the federal government ever balanced its budget. Under a balanced budget, Californians could make an educated guess that we’d only get about 74 cents of every federal tax dollar back, with the remaining 26 cents diverted to other states. If you want want to guess how much the federal government has to spend per dollar of taxes before your state breaks even, the inverse of relative return on the dollar, relative price per dollar can tell you. For California, that’s $1.35 in 2022.
Another way to think about California’s low relative return on the dollar is that is that the federal government is already diverting our tax dollars to other states, just in a sneaky way that gains plausible deniability from massive deficit spending.
How? Way before the Rockefeller Institute got into the taxation-and-spending-by-state game, the studies everyone quoted were done by the Tax Foundation. And when the Tax Foundation about return on the dollar, they only ever meant relative return on the dollar. Here’s how they justified that in their 2006 special report:
In the calculation of spending-to-tax ratios, however, an adjustment must be made to bring federal tax collections and federal spending into alignment. Therefore, a deficit is treated as an unfunded tax liability in the current year, allocated in the same fashion as the federal tax burden.
In layman’s terms, taxes we don’t pay today become debt that we pay off (with taxes) tomorrow.
Having seen how stable each state’s relative share of taxes is, it’s quite plausible that the future burden of paying of the debt is going to fall disproportionately on California, New York, and other states that have a larger relative share of taxes today.
Still, it’s pretty important to remember that actual return on the dollar and relative return on the dollar are very different things. Return on the dollar, the figure the Rockefeller Institute provides, is talking about cash flow: real dollars that are collected and spent. Whereas relative return on the dollar relies on more arcane accounting concepts like “unfunded tax liability.”
Personally, I see relative return on the dollar as a fantastic way of thinking about California’s relationship with other states and predicting how the federal government is likely to treat us in the future. But as a way of actually talking about money, it’s… debatable.
In any case, don’t make the mistake San Francisco Chronicle reporter John Wildermuth did when he wrote in 2020:
Ten years ago, then-Gov. Arnold Schwarzenegger was complaining that California received only 78 cents back for every tax dollar it sent to Washington, arguing that the state’s budget woes would disappear if the federal government would only play fair with funding.
It’s too late for Schwarzenegger, but a new study found that California has moved off the list of donor states and now takes in almost exactly as much in federal payments as its businesses and residents pay in taxes.
That “78 cents” figure almost certainly came from a Tax Foundation study (relative return on the dollar), whereas “takes in almost exactly as much” refers to the Rockefeller Institute study (actual return on the dollar).
Though, would anyone have read the article if it had started like this instead?
Ten years ago, then-Gov. Arnold Schwarzenegger was complaining that California received only 78 cents back for every tax dollar it sent to Washington, quoting a study that treated deficit spending as an unfunded tax liability in the current year, allocated in the same fashion as the federal tax burden.
Relative vs. actual balance of payments
Let’s bring things full circle and see what happens if we apply the Tax Foundation’s methodology to balance of payments (remember, that’s spending minus taxes).
Governor Schwarzenegger said the federal government should “play fair with taxes.” How much more public money would California have if our share of federal taxation were the same as our share of spending?
It turns out you get two different answers, depending on whether your baseline is taxes or spending.
Balance of payments relative to taxes (the red line) is what happens if you use the total amount of taxes paid by all 50 states as the baseline. In 2022, California paid about $760 billion in taxes, accounting for about 15% of federal taxes paid by states overall. But we only got about 11% of federal spending. What if we’d only paid 11% of federal taxes? The difference between 15% and 11% of total taxes is about $200 billion dollars, which is what’s shown in the graph. In a sense, that $200 billion dollars is how much of Californians’ federal tax dollars were diverted to other states—if you accept the Tax Foundation’s model that all the extra deficit spending California got in 2022 was just a sneaky way of putting us on the hook for future taxes.
Balance of payments relative to spending (the green line) does the reverse. What if, in 2022, we’d gotten 15% of federal spending, rather than the measly 11% we actually got? The difference, shown on the graph, is about $240 billion.
These are impressive numbers, and they’re a lot bigger than our actual $91 billion balance of payments (to be fair, also an impressive number). But they rest on the idea the idea that any extra spending California got from federal deficit spending doesn’t really count because we accrued an “unfunded tax liability”—basically, a share of the debt.
Whose debt is it anyway?
I think we need to take a closer look at this idea of states accruing “shares” of the federal debt.
Sites like the U.S. Debt Clock (content warning: really hurts to look at—and now it includes a “D.O.G.E Clock”??!!) will happily quote numbers like “debt per citizen”, implying that each state’s share of the national debt is proportional to its population. That would actually be a small victory for California. The reality is that states help pay interest on the national debt in proportion to their share of federal taxes, and for California, our share of taxes (15%) is significantly larger than our share of the population (less than 12%).
But that, frankly, is not how debt is accrued. You accrue debt by spending more money than you have. Like, if you use spend $500 with your credit card, and you make a payment of $450, the debt you accrue is $50. Can you imagine if your bank decided to put you on the hook for a share of debt that other credit card holders accrued because it made intuitive sense to them to allocate debt according to population?
So if we’re going to talk about states accruing shares of the debt, it ought to be based on balance of payments. When a state gets more federal spending than it pays for in federal taxes, that’s accruing debt. And if a state pays more in federal taxes than it gets back in spending, that’s paying off debt.
To truly track every state’s share of debt over time, you’d need a way of accounting for the shifting interest rates on the federal government’s various types of bonds, treasury notes, and other financial instruments. I admit I’m not prepared to do that.
But what I can do is pretty close: show you each state’s share of the federal deficit.
During the eight-year period the Rockefeller Institute has published data for, the federal government spent an average of $1.4 trillion per year more in all 50 states than it collected from them in taxes. While California was fiscally self-sufficient in most years, thanks to COVID relief, California actually received an average of $44 billion a year more in spending than we paid in taxes. Divide $44 billion by $1.4 trillion, and California’s share of the deficit is 3.1%. That’s a lot smaller than our share of the population!
Here’s what each state’s share of the federal deficit was in 2015-2022:
Two smaller states, Massachusetts and New Jersey, aren’t even in this graph because, despite all that COVID relief funding, they still paid more in federal taxes than they received in spending over that eight year period. In a way, the other 48 states owe them money.
What I think is really interesting, though, is that the 38 smaller states’ share of the deficit takes up about 60% of the graph. But together, these states only comprise about 40% of the population. How’d they pull that off?
Might it have anything to do with the fact that they elect 76% of the U.S. Senate?
A fairer relationship with the U.S.?
California’s fiscal relationship with the federal government can reasonably be characterized as abusive. We pay a much bigger share of federal taxes than our share of federal spending, even though we’re the state with the highest rate of poverty.
The natural impulse when you’re treated this way is to try to be treated more fairly. But honey, that isn’t how abusive relationships work. Sure, if we work hard at it and make the federal government look bad, they might give California a slightly higher share of federal spending, or raise the SALT cap a bit. But they’re never going to give us fair representation in the Senate. Heck, they’re probably never even going to respect us. A huge proportion of Americans, including half of Republicans, think California is “not really American“—kind of a red flag for our relationship.
The other reason it’s pretty foolish to hope and pray for a fairer relationship with the federal government is because that relationship comes with a crushing amount of debt. Currently the size of the United State’s public debt is $29.1 trillion (I’m leaving out the $7.3 trillion of intragovernmental debt because it’s literally money the federal government owes itself).
Based on the eight-year period the Rockefeller Institute studied, California has accrued about 3.1% of the federal debt. Imagine if Californians had to pay all that off ourselves. 3.1% of $29.1 trillion in federal debt is about $900 billion. These are all big numbers, so let’s use California’s $300 billion state budget. $900 billion is 3 budgets. To pay off our accrued federal debt, Californians would have to pay an extra three years worth of every thing we pay in state taxes.
Now think about what Californians actually do: pay interest on the federal debt with our federal taxes. In 2015-2022, Californians paid an average of 14.5% of federal taxes. 14.5% of $29.1 trillion is about $4.2 trillion. That’s fourteen budgets.
But if Californians shouldn’t hope for fair treatment from the United States, what should we hope for?
A different kind of relationship entirely
How about a different kind of relationship entirely? According to a YouGov poll we commissioned, 61% of Californians thought California would be better off if we peacefully become an independent country with a friendly relationship with the U.S.
Let’s imagine that. What would life after peaceful secession look like for Californians, fiscally speaking?
Surprisingly, our share of the U.S. national debt would almost certainly be zero. History has many examples of negotiated secession, and it’s rare for new countries to take on a share of their parent country’s debt. It’s also not what happened when the Philippines (about 10% of the U.S. population at the time) peacefully seceded from the United States in 1946.
Independence would also mean getting our federal tax dollars back; instead of paying taxes to the federal government, we’d pay them to California’s own state national government, which would spend nearly all of those tax dollars in California.
Would that mean California would suddenly be rolling in extra public money that we could spend on schools, health care, and the environment?
Sadly, no. In the long run, California gets just about as much in federal spending as we get in federal taxes. Remember, we actually got slightly more back in spending over the eight-year period we have data for.
That $91 billion negative balance of payments in 2022? It was offset by COVID relief in 2020 and 2021. That hundreds of billions of dollars of negative balance of payments relative to spending? It accounts for future taxes Californians would have to pay to finance the national debt, which, to repeat, is something we definitely should not wish for.
In fiscal terms, California without the federal government would look pretty much like California does now. If Californians, living in an independent California, wanted better public services (or lower taxes), we’d have to make smarter choices with our own tax dollars than the federal government does now. Sorry, that might sound like a very low bar under an administration that is currently laying off half the employees at the IRS as part of a larger effort to reduce budget deficits (yes, that IRS, the agency that makes sure people pay federal taxes). But I mean, better than the Biden administration, the Obama administration, the W. Bush administration. Better overall.
One obvious low-hanging fruit is health care. U.S. health care is notoriously fragmented and inefficient. If Californians took all the tax dollars and premiums and co-pays we put that into a single-payer system, we could save a lot of money.
Another low-hanging fruit is military spending. The U.S. spends as much on its military as the next nine countries combined, and the U.S. Department of Defense has failed seven consecutive audits. It’s pretty much the poster child for federal waste, fraud and abuse. And yet when polled last December, 80% of Americans said they wanted more military spending. When we studied military spending in 2018, we found that an independent California could save 18-53 billion dollars a year by having a smaller, more efficient military focused on self-defense (that’s $22-67 billion in today’s dollars).
Another savings opportunity: an independent California would no longer have state and federal agencies that do the same thing. We’d just have one EPA, one Department of Education, one Department of Transportation, and so on.
The downside: independence from the U.S. would mean Californians would have to come up with our own ways of preparing for fiscal shocks like the COVID pandemic and natural disasters. Yes, an independent California could borrow money on its own sovereign currency like any other country, but we couldn’t hope to get the same low interest rates the United States does.
The somewhat good news is because an independent California’s budget would be the size of our state budget and federal tax burden combined (about $900 billion a year), we’d only need to set aside about two-thirds of our annual budget in a rainy-day fund to get through something like the COVID pandemic.
Independence means growing up, fast
Right now, Californians live in a world where we can push a lot of hard choices about taxing and spending up to the federal level. We want housing to be more affordable, and one way to do that is for the government to subsidize federal housing. But, you know, government subsidies cost a lot of money, so in practice, California’s state government mostly focuses on improving the housing market and leaves more costly (and effective) solutions to the federal government. Historically, Californians have also just taken it as a given the federal government will swoop in with unemployment subsidies during a recession, or disaster assistance after a major wildfire or earthquake.
This passing the buck (our own bucks, mostly) to the federal government is embedded in California’s own constitution. Since 1979, an entire article of our constitution, the Gann Limit, has been devoted to keeping the overall size of California’s state government the same as it was in 1979. Think of it as California’s declaration of dependence on the federal government.
Prop 13 and other restrictions California voters have placed on our state government’s ability to borrow money and change our tax system are like nothing that exists in any country’s national constitution. No wonder California Democrats did an end-run around state government to help create Obamacare. California could have easily set up its own government-subsidized health care exchange years before, but that would have required changes to California’s tax system, which would have been a “heavy lift” politically for our poor tax-shy state legislators.
If California were a country, we’d be the country with the 5th largest economy. But being an actual country with the 5th largest economy would require a lot more political maturity than California state politicians are currently exercising.
California independence would mean growing up, fast. But then, the primary alternative is continued humiliation by an abusive parent (the United States) as we beg them to treat us more fairly.
Four ways to fiscal independence
According to that same poll, 62% of Californians believe that peaceful, negotiated secession from the U.S. is impossible (yes, even after being reminded that the Philippines pulled it off, somehow). For many readers of this article, that last section was nothing more than a thought experiment. I mean, Erwin Chemerinsky, one of California’s foremost legal minds, would disagree with you, but as a practical matter, I respect that you’re not going to put your time and effort into fighting for something you think is impossible.
If secession is off the table, and the status quo is, well, horrible, what can Californians do?
One way forward is to focus on fiscal independence—finding ways to keep as much of our tax dollars as far away from the federal government as possible, even if that means forgoing federal spending.
Becoming a country is just one of at least four ways to make California more fiscally independent from the federal government. Here are three other options that don’t require leaving the U.S.:
A smaller federal government: The federal government would do less things and collect less taxes, leaving state governments to fill in the gap. That seems a lot like the way we’re headed now, with executive orders to dismantle the Department of Education, Trump’s musings about eliminating the Federal Emergency Management Agency, and across-the-board cuts to the federal workforce.
California certainly has the tax base and the government know-how to take over for the federal government, but it’s unclear if our own politicians have the political will to make that “heavy lift.” At a certain point, the Gann Limit would get in the way and the question would have to go before California voters.
A do-it-yourself option: Obamacare gives states the option to run their own healthcare exchange or have the federal government do it for them. What if most of the federal government worked this way? Why shouldn’t states who think they could do the federal government’s job better themselves with their own federal tax dollars be allowed to try? For example, if a state wanted to take responsibility for, say, FEMA, the federal government could look at how much the state paid in taxes the previous year, multiply that by the share of total federal spending (not counting interest on the debt) that went to FEMA, and send that much money back to the state’s government. There should be some simple clear ground rules on how do-it-yourself dollars could be spent, but those rules would only be enforceable by the courts, not subject to the whims of the executive branch.
The do-it-yourself option would work great for California in particular because it would get around the Gann Limit, which only applies to tax dollars collected by the state. As a fiscally self-sufficient state, we’d get about the same amount of federal spending we do now, but way more ability to make choices that better suit Californians’ needs. And way less runaround from D.O.G.E. or whoever it is running the federal executive branch.
The do-it-yourself option might also be a smart way for Congress to come to a deal that avoids a government shutdown. As it stands, Republicans can’t offer Democrats spending concessions in exchange for voting to keep the federal government open because Democrats can’t trust the president to actually spend the money Congress agreed on. Do-it-yourself is also an essentially conservative solution that might appeal to many Republicans (even if they mostly live in fiscally dependent states).
California actually has a law on the books, SB 770, that requires our government to seek a do-it-yourself option on federally funded health care. That’s probably not going to go anywhere without the help of Congress, but it’s exactly the right place to start. Running our own health care system is an obvious opportunity for Californians to make things a lot more efficient.
Special autonomous status for California: Finally, we could forget about trying to craft a solution that works for every state, and just ask for more autonomy for California. After all California really is different: we’re systematically underrepresented in the federal government, the 5th largest economy in the world, and have a much higher cost of living than the rest of the U.S. (Also, in contrast to the rest of the country, we’re “not really American.”) Fiscally speaking, special autonomous status would look a lot like the do-it-yourself option, only it would be just for California, and non-optional.
Californians really like this idea. 66% of Californians think California would be better off than we are now if we negotiated special autonomous status within the U.S. And another 66% think California should form a permanent state commission dedicated to helping the state gain more autonomy from the federal government, including over our own federal tax dollars.
If you’re among the 38% of Californians, who, like me (and Erwin Chemerinsky) believe California could legally negotiate its way out of the U.S., autonomy within the U.S. might still be a good way to start—assuming we have still have a functional U.S. to do that in. Autonomy would give California a chance to mature politically before we take on the full challenge of being our own country. Political adolescence, if you will.
They’ll miss us when we’re gone?
Before I wrap up, there’s one set of concerns I want to address: what about the two-thirds of the U.S. population who live in fiscally dependent states? If California left the U.S. (literally or fiscally), what would happen to them? Isn’t California a “cash cow” for the United States? Why would they ever let us go?
By definition, fiscally dependent states receive more in federal spending than they pay in taxes (a positive balance of payments). Where does that extra money come from? A lot of it must come from California, right?
Well…
Maybe it’s better if you just see the graph for yourself.
It turns out, the federal government spends so much more than it raises in tax revenue that California’s negative balance of payments doesn’t make that much of a dent. Federal borrowing, not California, is the real “cash cow.”
Just to show you how insignificant massive deficit spending makes California’s contribution, let’s look at the biggest benefit any of the nine next biggest states got from California, in any year.
In 2022, fiscally dependent states got about 9.2% of their surplus federal spending from California, the highest of any year we have data for. In that year, North Carolina, the most fiscally dependent of the 10 largest states, got an extra 44 cents of spending for every dollar they paid in federal taxes. 9.2% of that 44 cents, that was us!
Yes, it’s only thanks to California that North Carolinians got an extra… doing the math… four cent return on the dollar in 2022. Four cents! (And they didn’t even say thank you!)
In theory, America’s ability to borrow money cheaply from the rest of the world relies, in part, on having California in its “portfolio” of states. But in practice, it has a lot more to do with the U.S. dollar being the world’s primary reserve currency and the United States never having missed a debt payment (so far!). Lenders to the U.S. might shrug if California peacefully negotiated our way of the country, even if we didn’t take a share of the debt with us. And if California achieved fiscal autonomy within the U.S., lenders probably wouldn’t even notice.
Yes, one day America will have to stop running massive deficits, start paying down the debt, and live within its means. Which would really mean living within the means of California and other provider states, which would mean squeezing us a lot harder than they do now.
In the long run, that is what it means for California to be a donor state.
The more you know…
Whew! That was a lot! I mean, it’s not like I made you learn the names of 50 different things in alphabetical order, but you’ve just gazed pretty deeply into a complex topic and seen it from nearly every possible angle. Please, treat yourself to a really good burrito or something—you’ve earned it!
And if you’re still not sure of the right way is to think about all this, great! There is no one right way. Let it marinate for a bit.
A few things I’m hoping everyone takes away from this article:
Looking at a state’s balance of payments from a single year (the $83 billion dollar figure) is a completely terrible way to understand any state’s fiscal relationship with the federal government.
On the other hand, if all you know is a state’s relative return on the dollar in a single year, you actually do have a pretty good guess how the federal government is going to treat that state in the future.
California pays a much bigger share of federal taxes (14-15%) than our share of the population (about 12%).
California is the state with the highest rate of poverty. Yet, we’re rock-bottom for federal spending per person in poverty; the federal government isn’t looking out for poor Californians.
Be wary of quoting deficit-adjusted figures that show California losing hundreds of billions of dollars per year. They’re not wrong, exactly, but it’s foolish for Californians to lay claim to a share of the national debt.
If California ever becomes an independent country, we’ll have about the same amount of public money, but none of the U.S. debt.
California is not a “cash cow” for the rest of the country; the real cash cow is deficit spending.
If the federal government ever balances its budget, Californians should expect to be squeezed hard.
Glossary
balance of payments: federal spending received minus federal taxes paid
balance of payments relative to spending: what a state’s balance of payments would be if its share of total spending received were changed to match its share of total taxes.
balance of payments relative to taxes: what a state’s balance of payments would be if its share of total taxes paid were changed to match its share of total spending.
calendar year: the normal year, from January through December. Compare to federal fiscal year.
consumer state: a state that pays a lesser share of total taxes than its share of total spending. Equivalently, a state whose relative return on the dollar is greater than $1.00.
deficit spending: spending more money than collected in taxes (which means going into debt)
federal fiscal year: October of the previous calendar year through September
fiscal independence: paying little or no taxes to the federal government, and receiving little or no spending in return. Do-able if your state is fiscally self-sufficient, hard if it’s fiscally dependent.
fiscally dependent (state): receiving more in federal spending than you pay for in federal taxes. Opposite of fiscally self-sufficient.
fiscally self-sufficient (state): paying more in federal taxes than you receive in spending. Opposite of fiscally dependent.
fiscal year: a year starting on an arbitrary month, for accounting purposes. See federal fiscal year
official poverty measure (OPM): number of people with income below the federal poverty line. Does not account for cost of living. Compare to supplemental poverty measure (SPM).
price per dollar (of spending): amount of taxes paid per dollar of spending received. Inverse of return on the dollar.
provider state: a state that pays a greater share of total taxes than its share of total spending. Equivalently, a state whose relative return on the dollar is less than $1.00.
relative price per dollar (of spending): share of total spending received divided by share of total taxes paid. Inverse of relative return on the dollar.
relative return on the dollar (of taxes): share of total spending received divided by share of total taxes paid. Similar to return on the dollar, but accounts for deficit spending.
relative share of spending: share of total spending received divided by share of total population. Equivalently, spending per person, relative to the average
relative share of taxes: share of total taxes paid divided by share of total population. Equivalently, taxes per person, relative to the average
return on the dollar (of taxes): amount of spending for every dollar of taxes paid
spending relative to poverty: share of total spending divided by share of the total number of people in poverty
state and local tax deduction (SALT): a federal tax rule that didn’t count money taken by state and local government as part of your income. Capped by the Trump tax cuts.
supplemental poverty measure (SPM): number of people experiencing poverty, accounting for cost of living
Trump tax cuts: the Tax Cuts and Jobs Act of 2017, which targeted California and other “blue” states by capping the state and local tax deduction (SALT).